SOFTWARE IMPACTS: PRIGSHARE: Automatization of indicator development in green space health research in QGIS.
URBiNAT Scientific Partners Marcel Cardinali and Uta Pottgiesser from the Institute for Design Strategies at the OWL University of Applied Sciences and Arts (Germany), are the co-authors of a new paper on the automization of indicator development in green space health research. The paper which draws on data collection and analysis conducted as part of the URBiNAT project, is published in the journal Software Impacts (Elsevier, ScienceDirect, 2023).
Abstract
In the interdisciplinary field of green space health research, there is a demand to reduce the effort to assess green space, especially for non-spatial disciplines. To address this issue, we developed AID-PRIGSHARE, an open-source script that automates over 400 QGIS processes to substantially reduces the time-intensive task of generating green space indicators. AID-PRIGSHARE calculates greenness, public green space, access to green infrastructure, and green space uses within distances of 100–1500 m around geolocations. This substantially reduces the effort for sensitivity analysis and may provide support for research that aims to understand the impact of different green space features and distances on health outcomes.
Software Features and Architecture
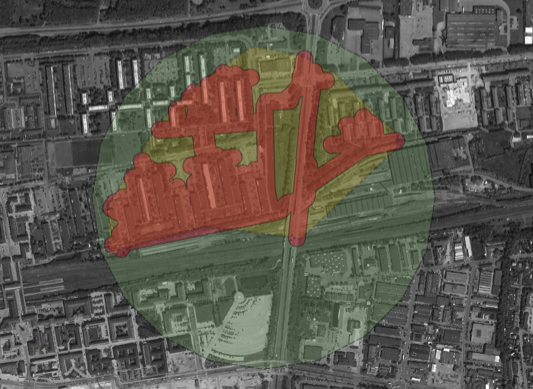
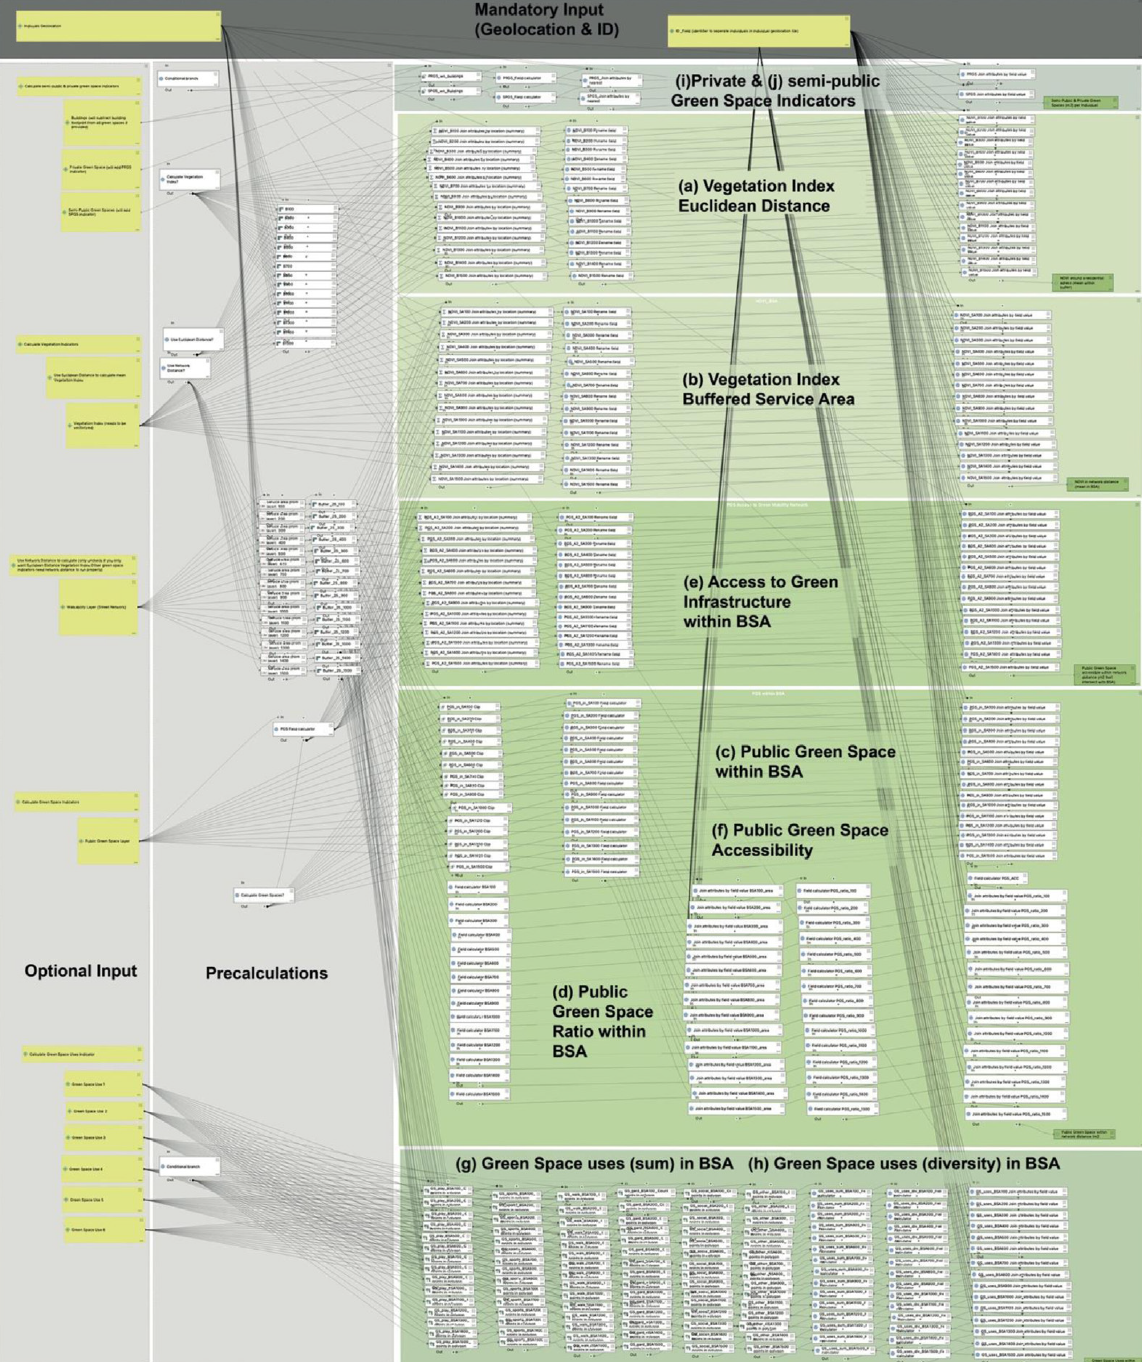
PRIGSHARE was developed within QGIS v3.22 with the graphical modeler feature to automate specific repetitive processes that are necessary to compare different indicators and/or different buffers. Next to Euclidean buffers, 25 m buffered service areas (BSA) to calculate network distances are available. BSA are a more precise version of network distances, especially for smaller distances. The algorithm will calculate the chosen indicators for distances between 100 m and 1500 m with 100 m increments. AID-PRIGSHARE allows the user to choose which of the following green space indicators should be generated by the algorithm:
AID-PRIGSHARE was developed within QGIS v3.22 with the graphical modeler feature to automate specific repetitive processes that are necessary to compare different indicators and/or different buffers. Next to Euclidean buffers, 25 m buffered service areas (BSA) to calculate network distances are available. BSA are a more precise version of network distances, especially for smaller distances. The algorithm will calculate the chosen indicators for distances between 100 m and 1500 m with 100 m increments. AID-PRIGSHARE allows the user to choose which of the following green space indicators should be generated by the algorithm:
- (a) Mean vegetation index (e.g. NDVI) in Euclidean distance (−1 to 1)
- (b) Mean vegetation index (e.g. NDVI) in BSA (−1 to 1)
- (c) The amount of public green space within BSA (m2)
- (d) Public green space ratio (public green space/total buffer area) within BSA (0-1)
- (e) Access to green infrastructure within BSA (m2)
- (f) Distance to the nearest public green space (rounded in steps of 100 m)
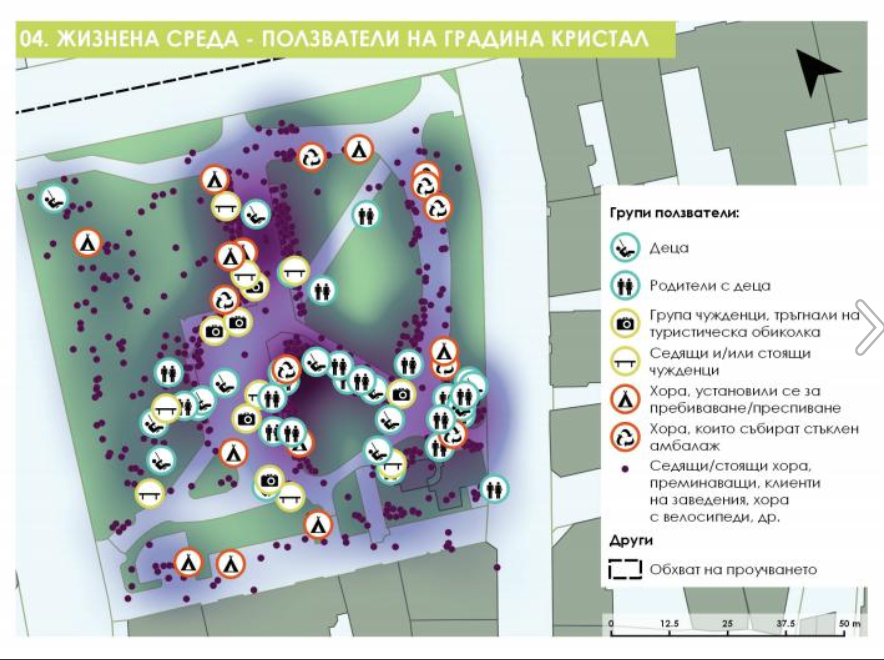
- (g) The amount of green space uses (playgrounds, sports fields, gardening,..) within BSA (number)
- (h) Diversity of green space uses within network distance (number)
- (I) The amount of private green space of an individual (m2))
- (j) The amount of semi-public green space of an individual (m2)
The architecture of the script combines the necessary steps to generate a specific indicator in a task chain that is repeated for every distance. Next to the mandatory input of the geolocation of points (e.g. the home address of an individual surveyed) and corresponding ID field, the input is optional and depends on the requested tasks. The script uses Boolean operators to indicate which tasks should be performed. To reduce computation time, the script makes use of intermediate results and reuses them to create additional indicators.
Source: Software Impacts
Authors & Co-Authors


Other URBiNAT Research Outputs
URBiNAT has a substantial and growing archive of academic papers, books, conference proceeding, policy white papers and other outputs in connection with the project. Click on the link below for access to all outputs.